
Scenario planning software that compares every what-if
Scenario planning software builds alternative forecasts, usually base, upside and downside, so you can see what a decision does before you make it. Budgeter.ai starts every scenario from your connected books, answers what-if questions in plain English and compares runway, ARR, break-even and cash needed side by side.
Read-only connections. Encrypted data. Cancel anytime.
Scroll sideways for all columns
| Metric | Downside | Base | Upside |
|---|---|---|---|
| Monthly growth | 2.0% | 4.5% | 7.0% |
| Hires next 12 months | 3 | 9 | 14 |
| Runway | 22.4 mo | 16.8 mo | 13.1 mo |
| ARR in 12 months | $2.05M | $2.86M | $3.92M |
| Break-even month | Not in horizon | Aug 2028 | Jan 2028 |
| Cash needed to break-even | $0 | $1.2M | $2.1M |
ARR in 12 months, relative to upside
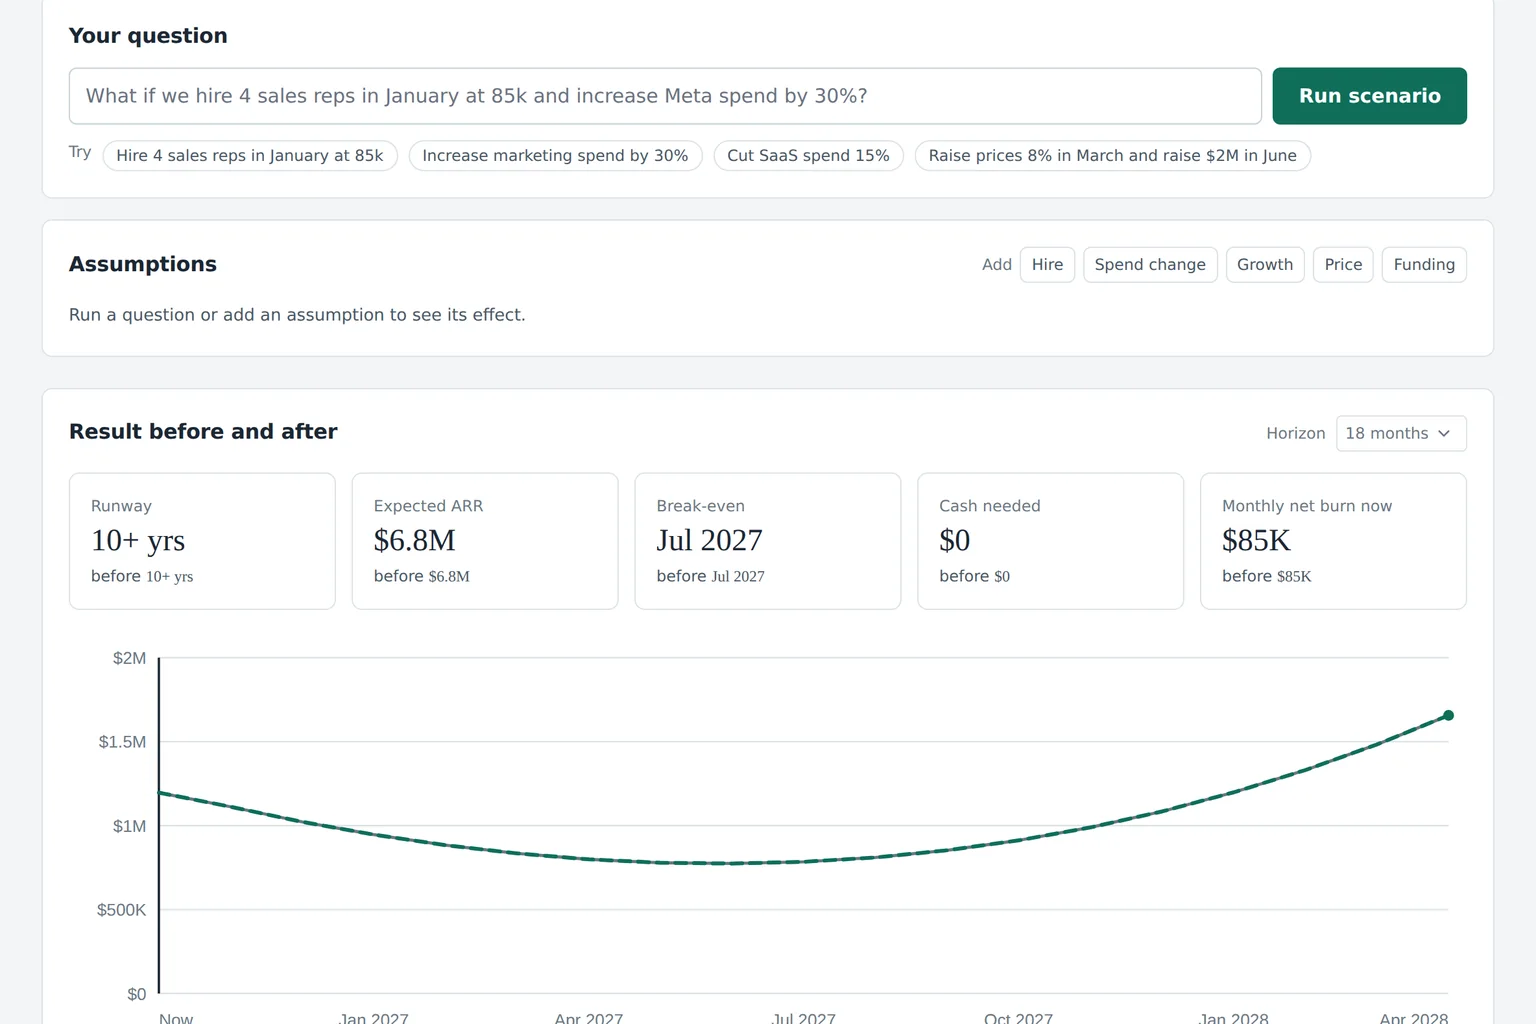
Example figures inside the product interface.
Why one forecast is never enough
A single forecast hides how uncertain it is. It shows one runway figure, one break-even month and one cash balance at year end, and every decision then rests on the assumption that the year goes roughly to plan. It rarely does. Deals slip, a key hire starts three months late, a large customer renegotiates.
Scenarios make the uncertainty visible. When the leadership team sees that runway is 22 months in a slow year and 13 months in a fast one, the discussion changes. The question is no longer whether the forecast is right, but which version of the year you are preparing for and what you would do if another one arrives.
The upside case deserves as much attention as the downside. Fast growth consumes cash, because hiring and marketing run ahead of revenue. In the example above the upside case has the highest ARR and the shortest runway, which is exactly the trap a single optimistic forecast tends to hide.
The drivers you can change
A scenario is a set of driver values. Change a driver and the whole model follows, from payroll to the bank balance.
Scroll sideways for all columns
| Driver | Where the base value comes from | What it moves | Plan |
|---|---|---|---|
| Revenue growth rate | Recent months in your books or Stripe revenue data | Revenue, ARR, cash, break-even | All plans |
| Churn and expansion | Stripe revenue data, split into new, expansion and churn | Net new ARR, burn multiple | Growth and up |
| Pipeline conversion | CRM pipeline and stages | Bookings and revenue timing | Growth and up |
| Hires and start dates | Payroll and the headcount plan | Payroll, benefits, runway | Growth and up |
| Cost lines and vendors | Ledger history by account | Operating expenses, cash | All plans |
| Price changes | Current revenue per customer | Revenue, ARR, break-even | All plans |
| Custom driver formulas | Your own logic, such as cost per new customer | Any linked line | Scale and Enterprise |
Hiring drivers come from the headcount plan and revenue drivers from revenue planning, so a scenario that delays two hires or lowers churn uses the same salaries, ramps and revenue splits as the rest of your model. Nothing is typed in twice.
What-if questions in plain English
You do not need to know which cells to change. Describe the situation and the AI CFO sets up the scenario for you to review.
You ask
What if growth halves for the next two quarters?
The scenario lowers monthly growth from 4.5 to 2.25 percent for six months, then returns to base. Runway rises slightly because variable costs fall, but ARR in 12 months drops by about 410,000 dollars.
You ask
What if we raise prices by 10 percent in April?
New and renewing customers move to the new price from April. With the churn assumption unchanged, break-even comes four months earlier. You can add a churn bump to test the risk in a second scenario.
You ask
What if we pause all hiring after the current offers?
Six planned roles are removed from the forecast. Monthly burn is 96,000 dollars lower by June and runway extends from 16.8 to 22.4 months. Revenue growth slows in the second half as sales capacity stays flat.
Every answer becomes a draft scenario with the drivers it changed listed at the top, so you can adjust a number before saving. The AI CFO explains its assumptions rather than hiding them, and questions count against the monthly limit of your plan.
Forecasts and scenarios are estimates based on your data and assumptions, not financial, investment, tax or accounting advice.
From what-if to the forecast in four steps
Scenarios are only useful if the one you choose becomes the plan you track. That last step is where spreadsheets usually break.
-
01
Start from the base case
Your connected books and current forecast become the base case automatically, so every scenario starts from real numbers.
-
02
Change the drivers
Adjust growth rate, churn, hiring dates, prices or a cost line, or describe the change in plain English and let the AI CFO set the drivers.
-
03
Compare side by side
Put two or more saved scenarios next to each other and read runway, ARR, break-even month and cash needed in one table.
-
04
Apply the one you choose
Promote a scenario to the forecast. Budget vs actual and the cash forecast then measure against the plan you actually decided on.
Applying a scenario updates your forecast, the 13-week and 12-month cash view and the runway figure everywhere in the product. The approved budget stays untouched, so the monthly budget vs actual review still compares against what the board agreed.
Each saved scenario keeps the date it was built and the actuals it started from. When you look back after a quarter, you can see which case reality followed most closely, which is a good test of how realistic the next set of assumptions is.
Saved scenarios per plan
Small Business keeps 5 scenarios, enough for base, upside, downside and two decisions under discussion. Growth keeps 25 and adds side-by-side comparison. Scale and Enterprise have no limit and add driver-based models with your own formulas.
Before you subscribe, the free runway calculator shows one unsaved scenario from a few numbers. All plan details are on the pricing page.
Scroll sideways for all columns
| Plan | Monthly | Yearly per month | Saved scenarios | Side by side | Horizon |
|---|---|---|---|---|---|
| Small Business | $149 | $74 | 5 | No | 24 months |
| Growth | $599 | $299 | 25 | Yes | 36 months |
| Scale | $1,999 | $999 | Unlimited | Yes | 60 months |
| Enterprise | $4,999 | $2,499 | Unlimited | Yes | 60 months |
Spreadsheet scenarios compared with Budgeter
Spreadsheets can model scenarios. The trouble is keeping them in sync with actuals and with each other.
Scroll sideways for all columns
| Task | Spreadsheet | Budgeter.ai |
|---|---|---|
| Creating a scenario | Copy the model to a new tab | Change drivers or ask in plain English |
| Keeping actuals current | Paste into every copy | One sync updates all scenarios |
| Comparing outcomes | Build a summary tab by hand | Side-by-side table, Growth and up |
| Linking hiring and revenue | Separate sheets, manual links | Shared headcount and revenue drivers |
| Applying a decision | Rebuild the main forecast | Promote the scenario to the forecast |
| Audit trail | File names and version history | Saved date and starting actuals per scenario |
Mid-market FP&A platforms offer strong scenario tools too, but they are priced from about 10,000 to 150,000 dollars a year and often need a demo call and an implementation project first. Simple planning tools for very small businesses, such as LivePlan at 15 to 40 dollars a month, focus on business plans and simple forecasts. Budgeter sits between them with public prices and self-serve setup.
Questions about scenario planning
Scenarios are estimates based on your data and assumptions. They help you prepare, they do not predict.
What is scenario planning in finance?
Scenario planning means building several versions of your financial forecast under different assumptions, usually a base, an upside and a downside case, and comparing their outcomes. It shows how much room the company has before a decision is made, not after.
How many scenarios should a company keep?
Three active ones is a practical number: base, upside and downside. Add a scenario for each major decision under discussion, such as a hiring plan or a price change, and archive it once the decision is made. Budgeter saves 5, 25 or unlimited scenarios depending on the plan.
What is the difference between a scenario and a sensitivity analysis?
A sensitivity analysis changes one input to see how much an output moves, for example churn from 2 to 3 percent. A scenario changes several related inputs together to describe a possible future, such as a slower market with lower growth, higher churn and a hiring freeze.
Can I compare scenarios side by side on every plan?
Every plan lets you build, save and switch between scenarios. Side-by-side comparison in one table is part of Growth and higher plans, which also raise the number of saved scenarios to 25, and unlimited on Scale and Enterprise.
Does applying a scenario overwrite my budget?
No. The approved budget stays as it is, so budget vs actual still measures against what was agreed. Applying a scenario updates the forecast, which is your current best view of the future. You can switch the forecast back at any time.
Build your first scenario from a few numbers
Try the runway demo with your revenue, costs and hiring plan, then connect your books to save and compare full scenarios.
Forecasts and scenarios are estimates based on your data and assumptions, not financial, investment, tax or accounting advice.